

The most accurate forecast you can build for the next 90 to 180 days probably does not rely on your attribution report at all. It relies on a few inputs you can defend, a range instead of a single number, and an incrementality check that tells you how much of your reported revenue would have happened anyway.
That is the short answer to the question behind "attribution and forecasting accuracy": forecasts are only as good as the measurement underneath them, and measurement is leaky. Platforms each claim the conversions they can see, so the same sale can be counted more than once. So you forecast with ranges, anchor them to experiments, and update on a schedule.
- Attribution tells you who got credit. Incrementality tells you what you caused. Forecast from the second whenever you can.
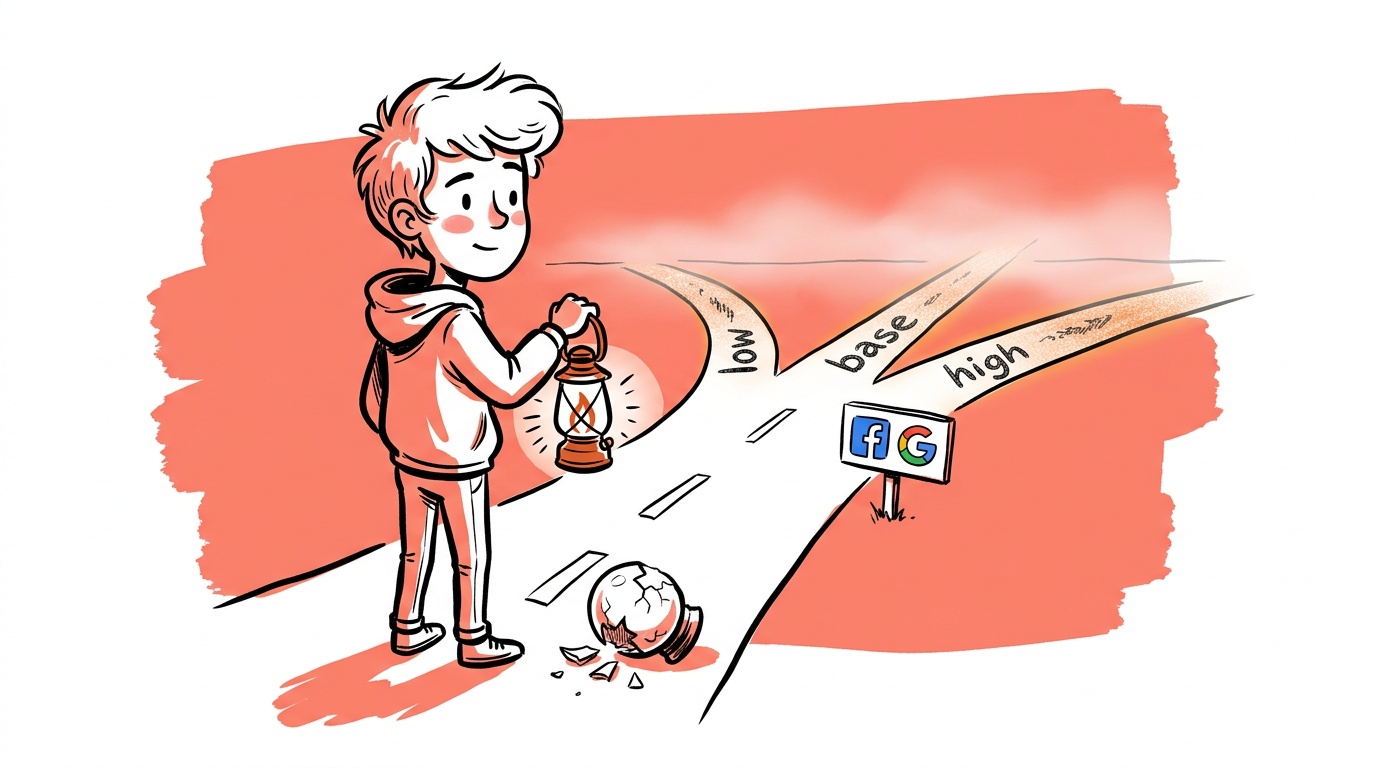
- Build forecasts as three scenarios (low, base, high), never a single number.
- Paid forecasts hinge on spend, cost per result, and conversion rate. SEO forecasts hinge on ranking movement, click-through, and lag.
- Paid responds in days. SEO responds in months. Do not put them on the same curve.
- Re-forecast on a fixed cadence and log your misses. Your error history is your best calibration tool.
Why attribution breaks forecasts
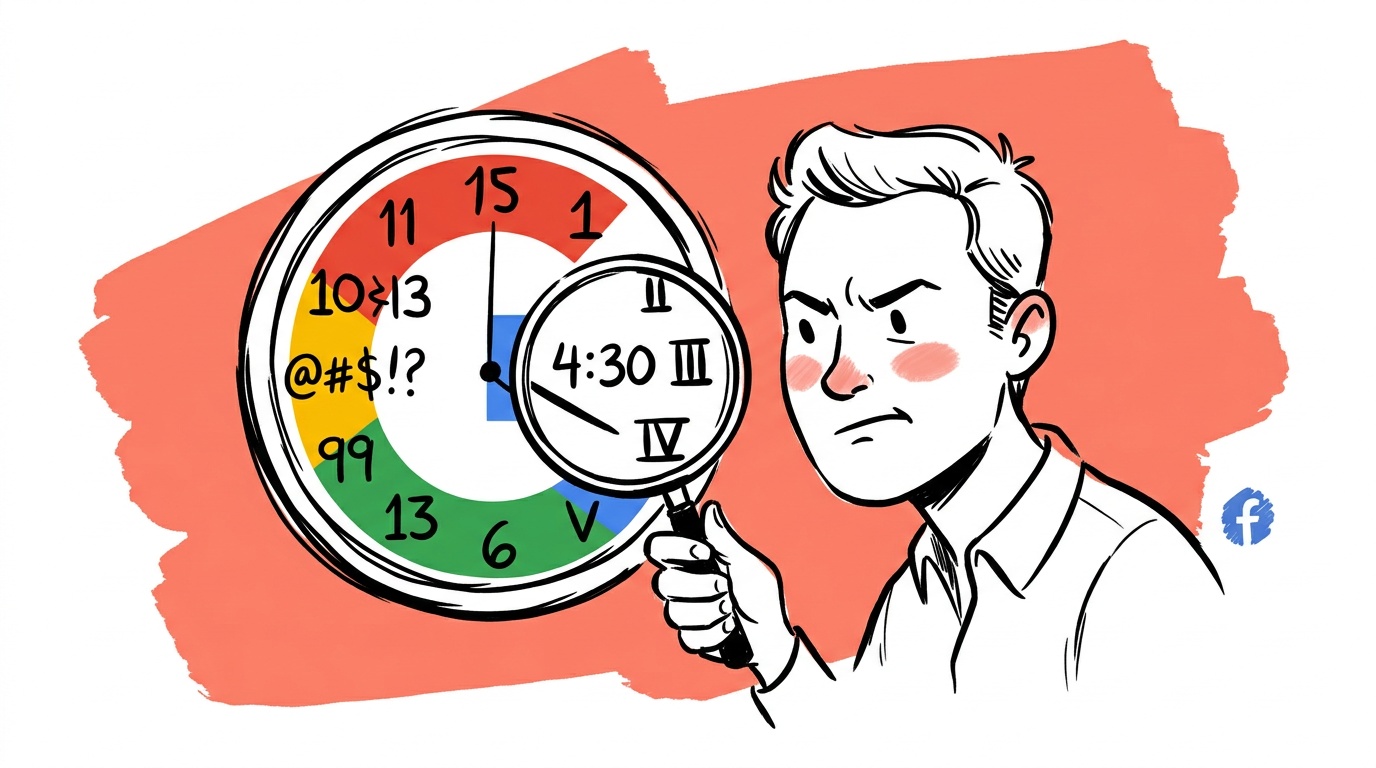
A forecast is a bet that the relationship between inputs and outputs will hold. If your inputs are "conversions as reported by the ad platform," you are betting on a number that several systems may be claiming at once. When Google, Meta, and your email tool each take credit for the same purchase, summing them overstates what your spend produced. Forecast from that, and you will project growth you cannot buy.
The problem compounds. A small overstatement in today's return becomes a large miss when you multiply it across a budget increase. The usual symptom: you scale spend and blended results do not move the way the dashboard promised.
If the sum of platform-reported conversions is meaningfully higher than the orders in your store or CRM, your attribution is overlapping. Forecast against the store or CRM number, not the platform total.
Attribution versus incrementality, in plain terms
Attribution assigns credit among touchpoints using a rule: last click, data-driven, or something similar. It is a bookkeeping method. It answers "which touch gets the credit?"
Incrementality answers a different question: "what would have happened without this spend?" You measure it by withholding ads from a comparable group, through geo holdouts, audience holdouts, or platform lift studies, and comparing outcomes. The gap is your incremental lift.
Report both, and do not let one pretend to be the other. Attribution is useful for day-to-day optimization inside a channel. Incrementality is what you trust when deciding how much total budget to commit. For a video walkthrough of that split, see Reporting on Incrementality and Attribution models, Lesson 36.
A worked example of the calibration factor
The numbers below are illustrative, not benchmarks. Say a channel reports 1,000 conversions in a month. A lift test on that channel shows 600 of them were incremental. Your calibration factor is 600 / 1,000 = 0.6.
Now your forecast. If the platform-based projection for next quarter is 3,000 conversions, the calibrated base case is 3,000 × 0.6 = 1,800. For a range, test the factor itself: use a lower factor (say 0.5) for the low case and a higher one (say 0.7) for the high case, which gives 1,500 to 2,100. Then layer your scaling penalty on top if you plan to raise spend.
Re-run the test periodically, because the factor drifts as audiences saturate and auctions change.
Forecasting paid: spend, cost, and conversion
Paid forecasting is the easier half because the feedback loop is short. Break it into three levers:
- Spend: what you will actually put in, including pacing constraints.
- Cost per result: usually rises as you scale, because you reach less efficient audiences.
- Conversion rate after the click: driven by your site, offer, and seasonality.
Forecast each as a range. For cost per result, build in a scaling penalty rather than assuming today's efficiency holds at double the budget. Use your own history of what happened to efficiency the last time you raised spend. If you have never scaled, say so and widen the range.
The walkthrough in Forecasting Growth: How to Project SEO and Paid Results 90 to 180 Days From Now covers this style of projection across both channels. Our addition is the calibration step: discount platform-reported results by what your incrementality evidence supports before you project.

Live today.
The full campaign — copy, images, targeting — generated for your site and deployed paused for your approval.
Forecasting SEO: lag, rank, and click-through
SEO is slower and lumpier. The chain looks like this: content or technical change, then indexing, then ranking movement, then clicks, then conversions. Each link has delay and uncertainty, which is why a 90 to 180 day window fits the channel. Over a few weeks, SEO movement is hard to separate from normal fluctuation.
A workable model:
- Start from the queries you already rank for and their current positions.
- Estimate realistic position gains for pages you are improving, not every page.
- Apply a click-through curve to the new positions, using your own Search Console data rather than a generic benchmark.
- Apply your real conversion rate for organic traffic, which usually differs from paid.
Google Search Console documentation explains the performance data you will be pulling. Keep in mind that AI-generated answers and richer results pages can reduce clicks even when rankings hold, so treat click-through as a variable to monitor, not a constant.
Keep paid and SEO on separate curves
Paid scales roughly with spend and responds quickly. SEO compounds slowly and then plateaus or decays if neglected. Blending them into one growth line hides both behaviors and leads to bad calls, like cutting paid because organic "will pick up the slack" on a timeline it cannot meet.
Forecast them separately, then add them. Show the paid line with its scaling penalty and the SEO line with its lag. Also note overlap: branded search often rises when paid and other awareness work succeeds, and a naive model will credit that lift to SEO.
Build the scenario ranges and a review loop
Make three scenarios and name what changes between them:
- Low: efficiency degrades as you scale and SEO gains arrive late.
- Base: efficiency holds with a modest penalty and SEO lands mid-window.
- High: creative or offer improvements lift conversion and rankings move early.
Then set a review cadence; monthly works for most small teams. At each review, compare actuals to the range, write down which assumption missed, and adjust. After a few cycles you will know whether you consistently overestimate cost efficiency or underestimate SEO lag. That error log is more valuable than any single forecast.
For primary sources on measurement design, Google's documentation on conversion lift and Meta's Conversion Lift overview describe how the platforms run holdout experiments, which is the cleanest route to the calibration factor above.
FAQ
What is the difference between attribution and incrementality?
Attribution distributes credit for conversions across touchpoints using a rule. Incrementality measures how many conversions happened because of your ads, by comparing exposed groups to a holdout. Attribution is for optimization; incrementality is for budget decisions.
How far ahead can you realistically forecast paid and SEO results?
Ninety to 180 days is a practical window for SEO, because ranking changes and traffic take months to show up. Paid can be projected over shorter horizons, but the longer window forces you to account for scaling effects.
Why are my platform-reported conversions higher than my actual sales?
Each platform counts conversions it can claim, and the same sale can be claimed by more than one. Compare the combined platform total against orders in your store or CRM to see the overlap.
How do I forecast SEO traffic?
Start with current rankings and impressions from Search Console, estimate position gains for the pages you will improve, apply your own click-through rates by position, and multiply by your organic conversion rate. Present it as a range.
Should I use one forecast number or a range?
Use a range. Three scenarios with stated assumptions are more honest and more useful than a single point estimate, because they show what must go right or wrong.
How often should I update a forecast?
Monthly is a good default. Compare actuals to your range, note which assumption missed, and revise. Update sooner after a major change in budget, site, or tracking.
Can I run an incrementality test on a small budget?
Often yes, with simple designs like a geographic holdout or a time-based pause, though small tests give wider uncertainty. Use the result as a directional calibration factor, not a precise one.
The takeaway
Pick one channel this week and run a holdout: pause spend in one region or audience, and compare. Whatever gap you find between that result and your dashboard is the haircut to apply to every forecast you write next quarter. If you have never measured it, what number are you currently forecasting from?
Live today.
The full campaign — copy, images, targeting — generated for your site and deployed paused for your approval.

We build AdControlCenter — AI-powered ad management for small businesses, online stores, SaaS companies and service providers. We write what we'd want to read: real numbers, no fluff, the things we wish we'd known when we started.
More from the team →